How to Interpret CPAP Data: AHI, Leak Rate, and Usage Hours
Most people who start CPAP therapy think of the machine as something that pushes air. It does that, but it is also quietly recording your night. Every morning, there is a fresh set of numbers waiting, and for years, many users never look at a single one of them.
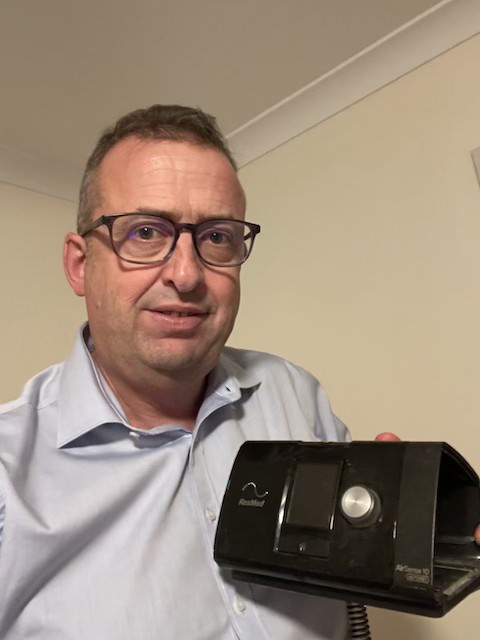
My background is in computer science rather than medicine, so the idea of a device that logs detailed data every night has always interested me. I am not a doctor, and nothing here is medical advice. What I can offer is the perspective of someone who has lived with severe obstructive sleep apnea for more than a decade and has spent a lot of mornings making sense of what the machine reported.
This guide walks through the numbers that actually matter: AHI, leak rate, usage hours, and a few supporting metrics. Once these click into place, your data stops being a wall of figures and becomes a practical tool for understanding your own sleep.
Why your CPAP data is worth understanding
CPAP therapy is not a set-and-forget arrangement. Masks wear out, cushions lose their shape, your weight and nasal congestion change, and your pressure needs can drift over months and years. The data is how you catch those changes before they quietly erode your sleep. A mask that sealed perfectly a year ago can develop a slow leak you would never notice on feel alone, and the report is often the first thing to flag it.
There is also a simple motivation point. When you can see the effect of your therapy in concrete numbers, it is far easier to stay consistent with it. A good night becomes something you can recognize rather than guess at, and a bad one becomes something you can act on. If consistency is the part you find hardest, I have written separately about how to stay consistent with CPAP therapy, and the data is one of the tools that helped me most.
The goal is not to become obsessed with charts. It is to know what a normal night looks like for you, so that an unusual one stands out and tells you something.
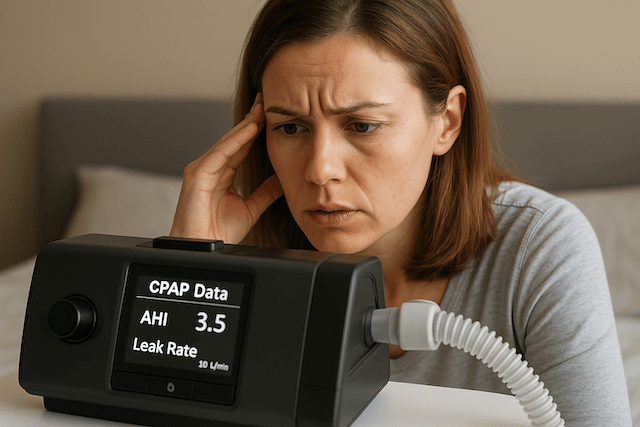
AHI: the headline number
AHI stands for the apnea-hypopnea index. It is the number of times per hour that your breathing either stops or becomes significantly shallow during sleep. An apnea is a near-total pause in airflow lasting at least ten seconds. A hypopnea is a partial reduction, usually a drop of around thirty percent or more, also lasting at least ten seconds. Add the two together, divide by your hours of sleep, and you have your AHI. I have written a fuller explanation in my dedicated guide to the AHI if you want the details.
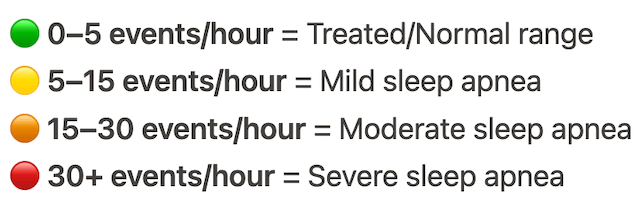
The severity scale is widely standardized. According to the Sleep Foundation, an AHI under 5 is considered normal, 5 to 15 is mild sleep apnea, 15 to 30 is moderate, and 30 or higher is severe. The Cleveland Clinic describes it the same way, as a scale providers use to rank how often your breathing is disrupted across an hour of sleep.
On therapy, the goal is to bring your AHI under 5, and lower is generally better. This is also where it helps to understand what the machine actually counts as an event. If you are seeing a number you do not expect, my article on CPAP events per hour explains how those events are tallied and why the figure can move from one night to the next.
When I was diagnosed, my AHI was 51. That sat well into the severe range, and looking back it explains a great deal about how exhausted I was for years. These days, on CPAP, a typical night sits around 10. That is a dramatic drop from where I started, and the difference in how I feel is hard to overstate. It is also worth being honest about what a 10 means. On the standard scale it still falls in the mild range rather than the normal range, so it is a number I keep paying attention to rather than treating as finished, and I review it against how rested I actually feel. If you want the longer version of how I got from there to here, that story lives on my Living With Sleep Apnea page.
That last point matters for everyone, not just me. A low AHI paired with ongoing daytime tiredness is a signal to look closer, not a reason to assume all is well. The number and the felt experience belong together. If the machine says your night was excellent but you wake up unrefreshed, something is worth investigating, and that is a conversation to have with your clinician rather than a problem to solve alone.
Leak rate: is the air going where it should
Leak rate measures how much air is escaping from your mask system. Some leakage is intentional and designed in. Every mask has small vent holes that release exhaled air, and that venting shows up as a baseline figure. The number you care about is the unintentional leak, the air escaping because of a poor seal.
A degree of unintentional leak is normal. Too much causes two problems. It can dry out your mouth and nose and disturb your sleep, and beyond a certain point, it interferes with the machine’s ability to deliver and measure your therapy accurately. In other words, a heavy leak does not just feel bad. It can also make the rest of your data less trustworthy.
Manufacturers set their own thresholds. On a ResMed machine like mine, the software treats a leak at or above 24 liters per minute as a large leak, and it reports this as a 95th percentile figure, meaning the leak level you stayed at or below for 95 percent of the night. Philips machines use a 90th percentile reading, so leak numbers are not directly comparable from one brand to another. If you ever check someone else’s figures against your own, make sure you are comparing the same measurement.
High leak usually comes down to one of a few causes. The mask may be the wrong size or worn out, the cushion may have lost its shape, the headgear may be too loose or stretched out, or your mouth may be falling open during the night. My guide to why a CPAP mask leaks goes through that troubleshooting in order.
The fixes follow the causes. Refitting or resizing the mask solves a surprising number of cases. Replacing a tired cushion solves more. If your mouth opens at night and you wear a nasal mask, a chin strap can help, and I have compared options in my post on the best CPAP chin straps. Some people who keep fighting leaks find that a different mask style suits them better, which is where my comparison of nasal and full face masks is useful.
For me, the mask question was settled early. I am a chronic mouth breather, so a full face mask was always going to be the right fit, and it has been the type I have used throughout my therapy. If you are a mouth breather too, that is worth factoring in before you spend months fighting leaks with a mask style that was never going to seal well for you. Persistent dry mouth, by the way, is often a leak symptom rather than a separate problem, and I have written about CPAP and dry mouth as its own topic.
Usage hours: compliant is not the same as treated
Usage hours record how long you wore the mask each night. This is the metric insurers and Medicare care about most. The common compliance standard is at least four hours per night on at least 70 percent of nights across a 30 day window. Meeting it is what keeps coverage in place, and I have covered the details in my article on CPAP compliance.
Here is the catch. Four hours satisfies a billing rule. It does not treat your sleep apnea for the rest of the night. If you sleep seven or eight hours but only wear the mask for four, your AHI for those four hours might look excellent while the remaining hours go untreated. The report can show a compliant, healthy-looking night that still leaves a large part of your sleep unprotected.
So there are really two questions buried in the usage data. Did I meet the compliance threshold, and did I wear the mask for my whole night. The second is the one that determines whether the therapy is doing its job. The aim is to wear the mask for as long as you actually sleep. If the mask is coming off in the night without you noticing, that is itself a clue, often pointing back to comfort or leak issues that are worth solving.
I will be honest that wearing it all night is not always effortless. Early on it takes adjustment, and there are still nights, particularly with a cold or a blocked nose, when it is harder than usual. If the early weeks are where you are struggling, my piece on overcoming CPAP anxiety covers what helped me get past that stage. The point is not to be perfect every night. It is to keep the long-term trend pointing in the right direction.
Pressure data: what the 90th and 95th percentiles tell you
If you use an automatic machine, your pressure is not fixed. The device raises and lowers it through the night in response to what your airway is doing. The report usually summarizes this with a 90th or 95th percentile pressure, which is the pressure at or below which the machine operated for most of the night.
This figure is useful for fine-tuning and for conversations with your clinician. If your percentile pressure sits close to the top of your machine’s allowed range, it may suggest the range needs revisiting. If it sits low and steady, your therapy is comfortably within bounds. My guide to CPAP pressure settings goes into how these numbers are read and adjusted, and if you are unsure whether you even have an automatic machine, my explanation of how auto CPAP works covers the difference.
The important habit is not to change pressure settings on a whim because of a single number. Pressure is a clinical setting. The data informs the conversation with your sleep team, it does not replace it.
Other metrics worth a glance
A few more figures appear on most reports, and they are useful as context rather than as headline numbers.
Mask fit, on machines that report it, is often shown as a simple rating, such as good or poor. A poor rating is usually a prompt to check for leaks rather than an alarm in itself.
Respiratory rate is the number of breaths you take per minute. For most users, it is background information, but a rate that is very high, very low, or irregular over time is something to mention to a clinician. I have written more about sleep respiratory rate and what tends to be typical.
Flow limitation describes subtle restrictions in your breathing that fall short of a full hypopnea. Some machines flag it as an early sign of mild airway narrowing. On its own it is rarely a cause for concern, but a consistent pattern can be useful context.
The principle across all of these is the same. One unusual reading on one night is rarely meaningful. A pattern that holds for a week or more is what deserves attention.
Where to find your data
There are three levels of detail available, and you can choose how deep you want to go.
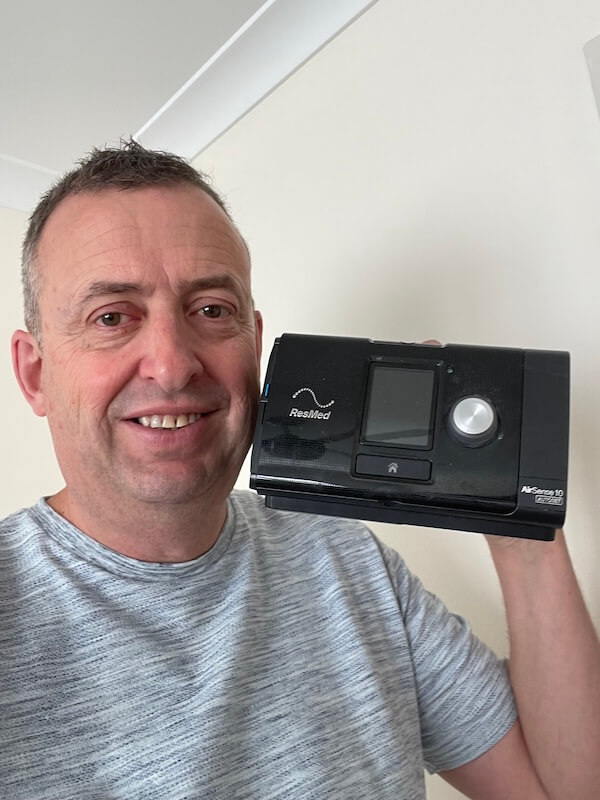
The first is your machine’s own screen. Most CPAP machines show a basic morning summary covering usage, AHI, and a mask fit or leak indicator. It is enough for a quick daily check. It is worth noting that some travel machines, including the ResMed AirMini I use for trips and camping, have no screen at all, so the companion app is the only way to see anything.
The second is the manufacturer’s app. ResMed machines, including the AirSense 10 I have used for the better part of a decade, pair with the myAir app, which gives a clean daily summary and a simple score. Other manufacturers provide their own apps. For most users this is the right everyday tool, more readable than the machine screen and easy to check over morning coffee. If you are weighing a newer machine, my review of the ResMed AirSense 11 covers how its reporting compares.
The third level is the detailed data stored on the SD card. If you want to see the full picture, including graphs the apps do not show, free software called OSCAR reads the card directly and works across most major brands. It is the most powerful option and also the most involved to set up. I have walked through it in my guide to OSCAR CPAP software.
You do not need all three. A lot of users do well with the app alone. The card and OSCAR are there for the nights when the simple summary is not telling you enough.
Turning numbers into better sleep
The reason to learn this data is not the data itself. It is what the data lets you do.
When something feels off, the report usually points you toward the cause. Waking with a dry mouth sends you to the leak rate. Feeling unrefreshed despite a good score sends you to the usage hours and to how much of the night was actually covered. A slowly creeping AHI sends you to the condition of your mask and to a conversation with your clinician. My broader guide to troubleshooting CPAP problems connects the common symptoms back to the numbers behind them.
The habit that has served me best is simple. Know what an ordinary night looks like for you across these few metrics, glance at the summary each morning, and act when a pattern shifts rather than reacting to every single night. CPAP data rewards steady attention, not anxiety. A single odd night is usually just a single odd night.
Your machine is doing more than moving air. It is handing you a clear, nightly account of how you slept and how well your therapy is working. Learning to read it is one of the most useful things you can do for your own rest, and it does not take long to get comfortable with the handful of numbers that matter.
Final thought
You do not need to become an expert in sleep medicine to get value from your CPAP data. You need to understand four or five numbers and check them with a bit of regularity. Do that, and the machine becomes a genuine partner in your therapy rather than a box on the nightstand. Better sleep tends to follow from paying attention.
⚠️ MEDICAL DISCLAIMER This blog provides general information only and is not a substitute for professional medical advice, diagnosis, or treatment. Sleep apnea is a serious condition, and CPAP equipment should be used under proper medical supervision. Always consult your doctor or sleep specialist before starting, stopping, or changing any therapy. I share personal experiences as a CPAP user, not as a medical professional. Individual results vary. For medical guidance, please consult a qualified clinician or the American Academy of Sleep Medicine (aasm.org).